News

Recently, the US Census released the results of its monthly Value of Construction Put in Place Survey. The survey provides estimates of the total dollar value of construction work done in the U.S. This data includes design and construction spending for public and private projects.
The seasonally adjusted annual rate of $2.15 trillion for September 2024 represents a monthly increase of 0.1%. This is positive increase reverses the monthly declines that began in June 2024. Private construction saw change and was flat at 0.0% monthly growth, while Public construction increased 0.5%.
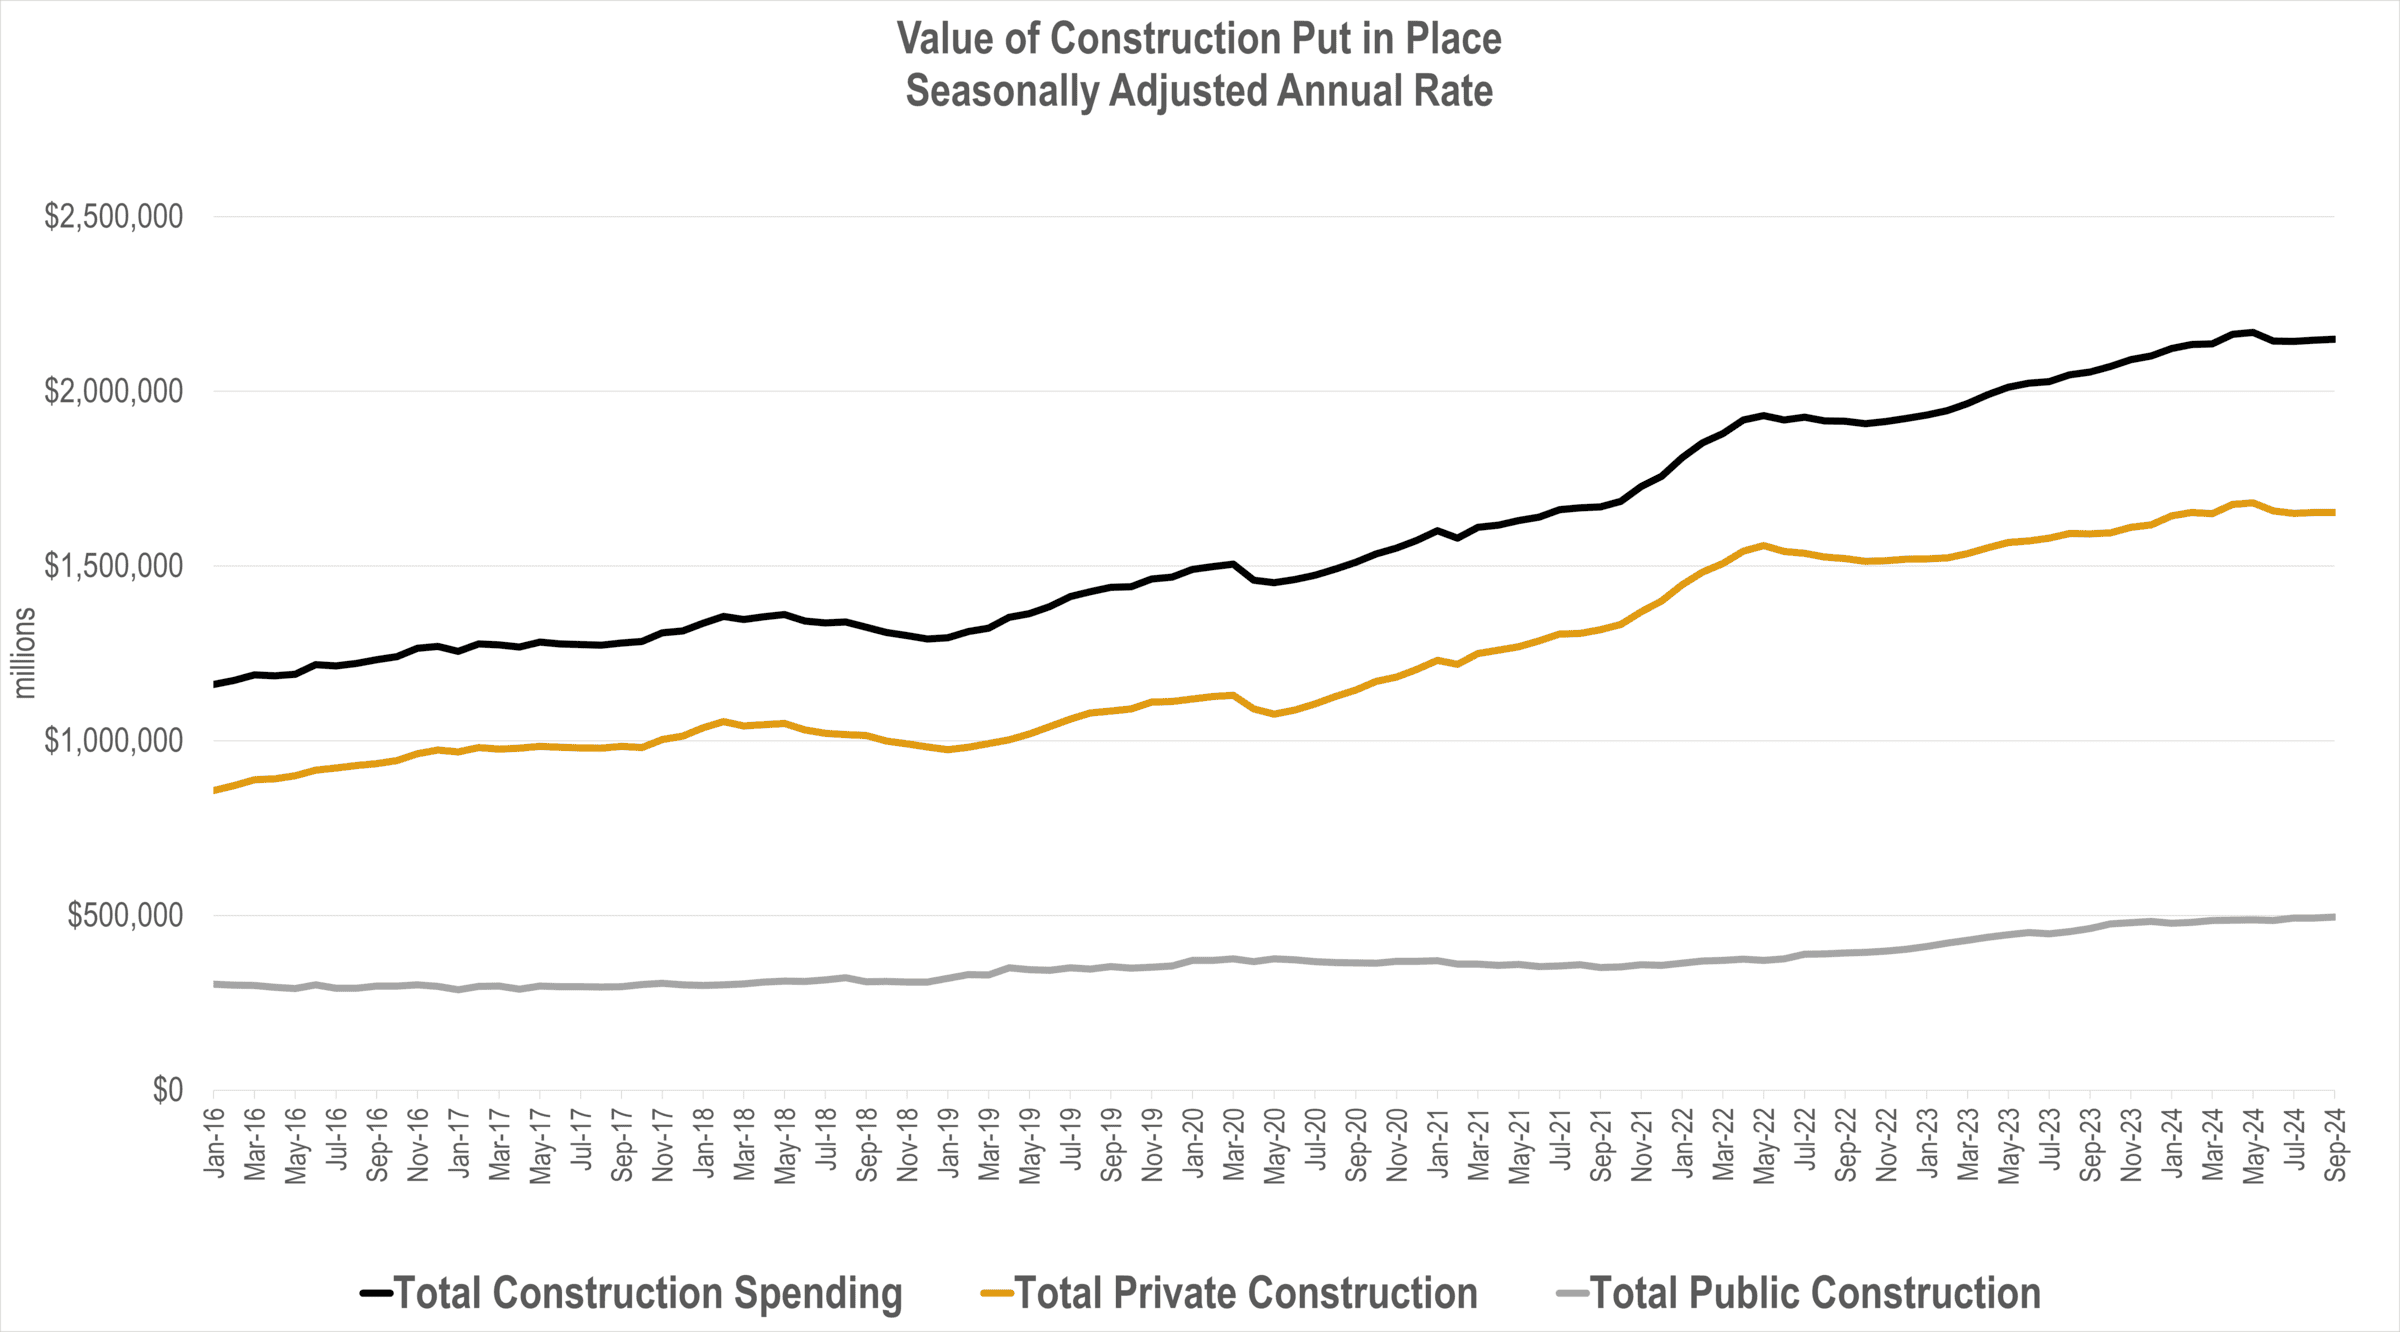
Source: US Census Value of Construction Put in Place Survey November 1, 2024 release
While the latest continues the trend of construction growth being flat since Spring 2024, nominal year over year growth is still positive at 4.6%. Overall economic growth in the US continues to remain strong, with recent estimates for 2024 Q3 GDP growth reported to be 2.8%.
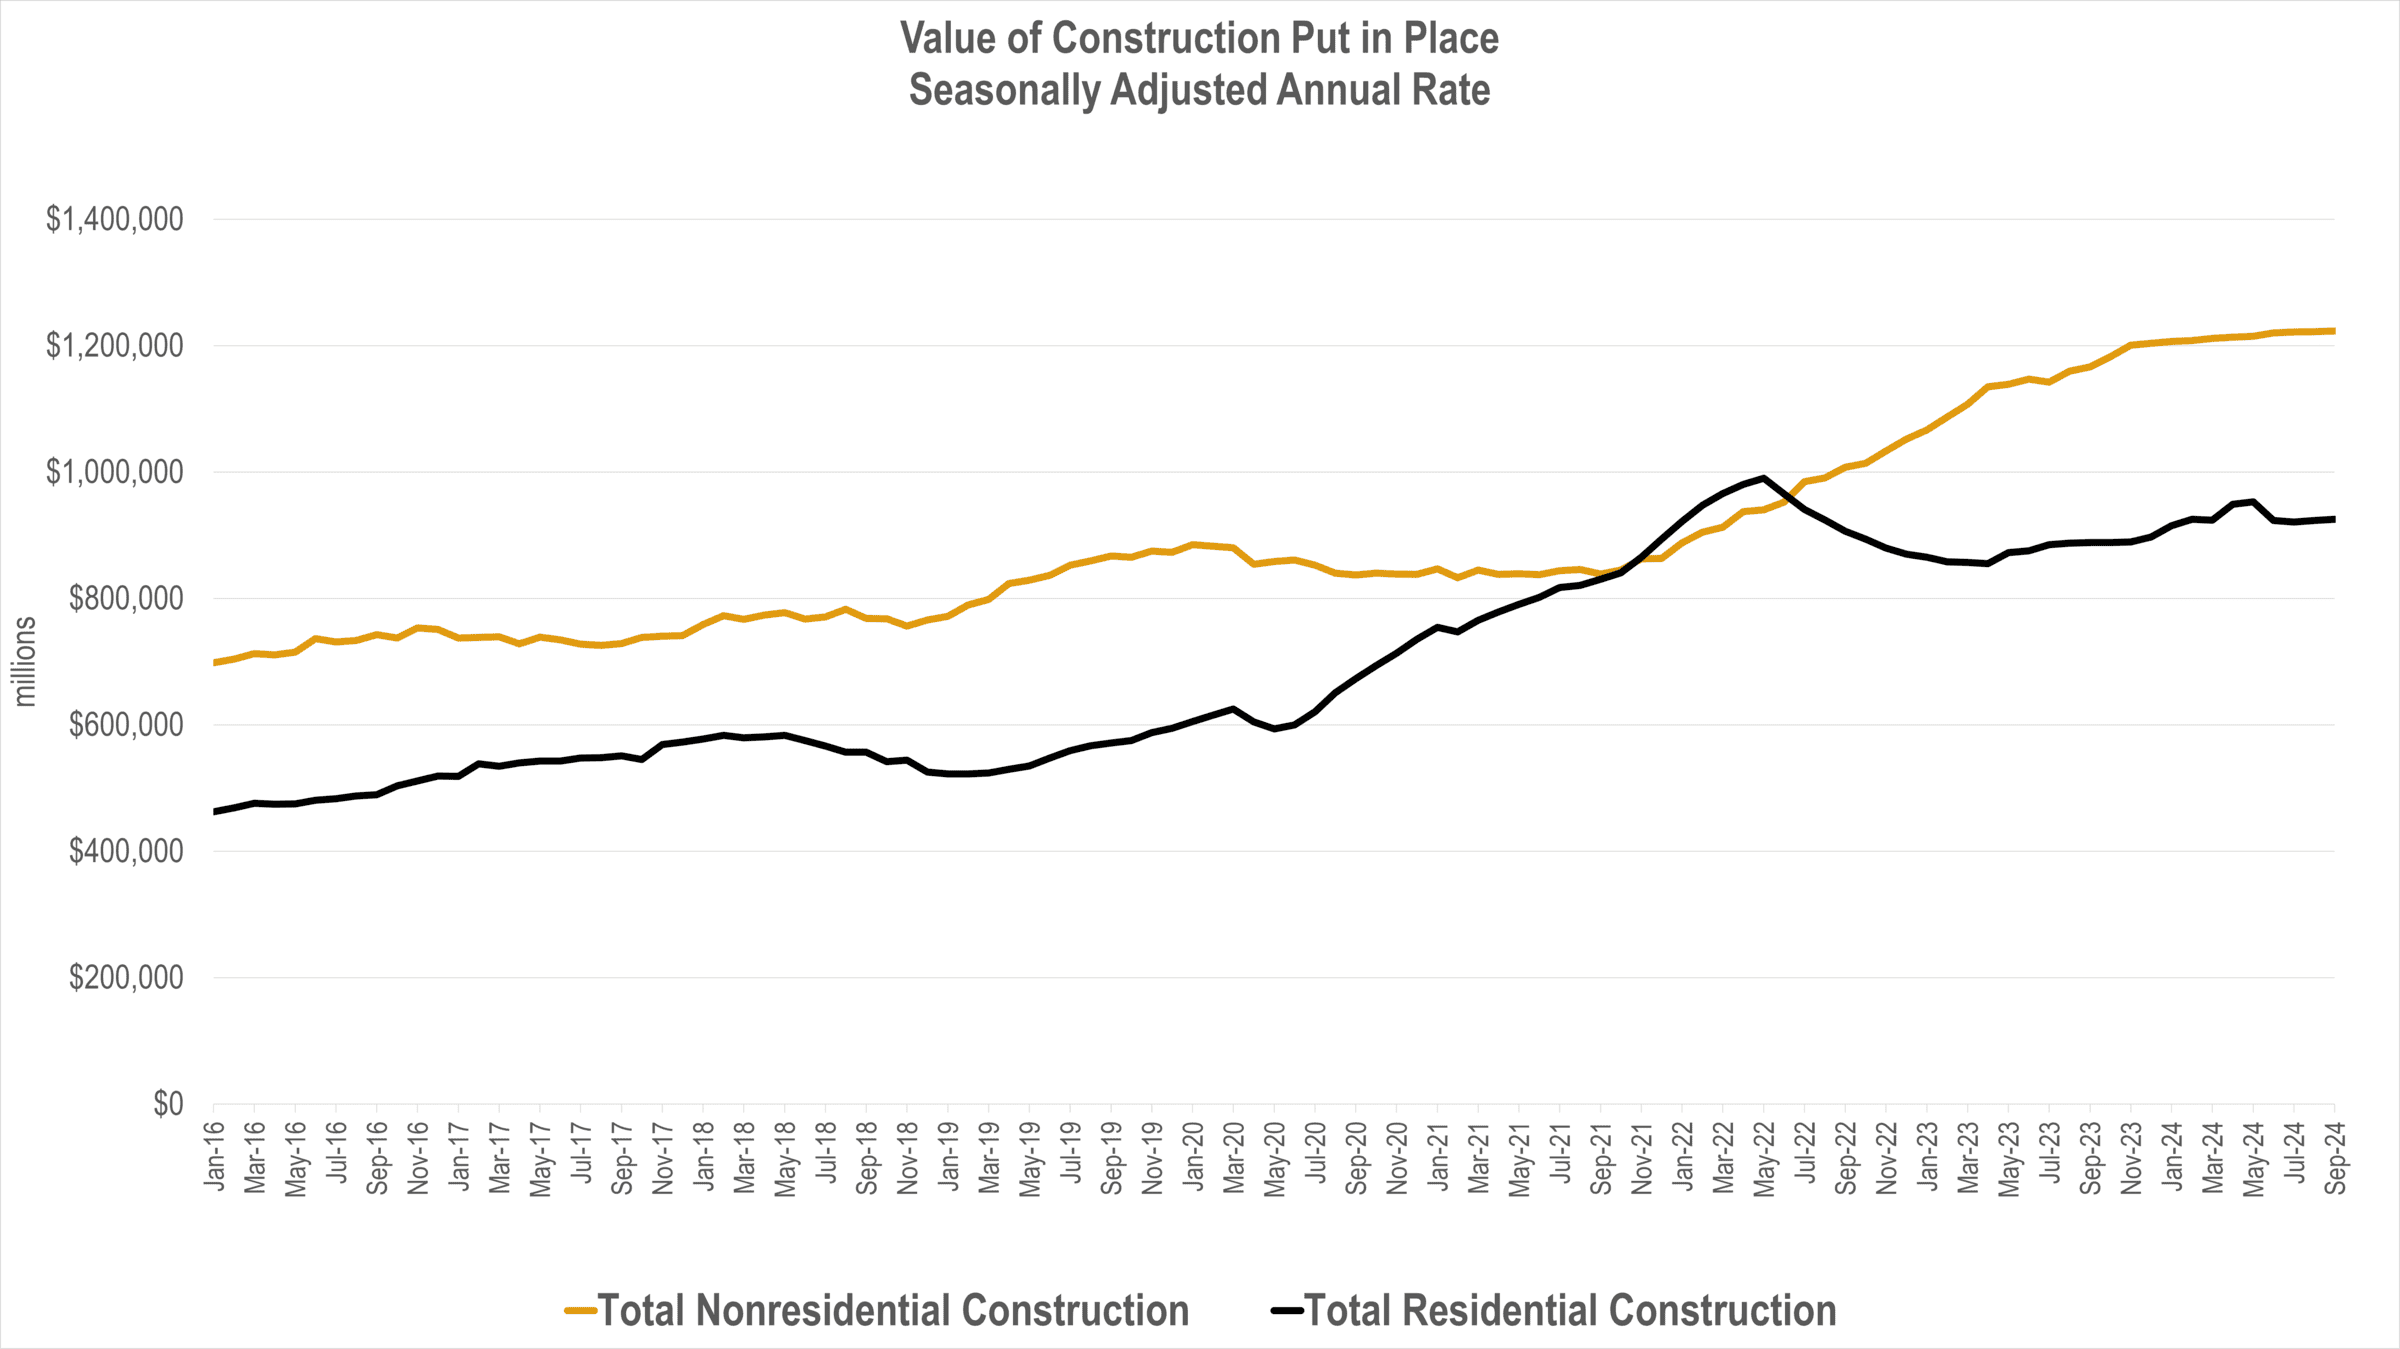
Source: US Census Value of Construction Put in Place Survey November 1, 2024 release
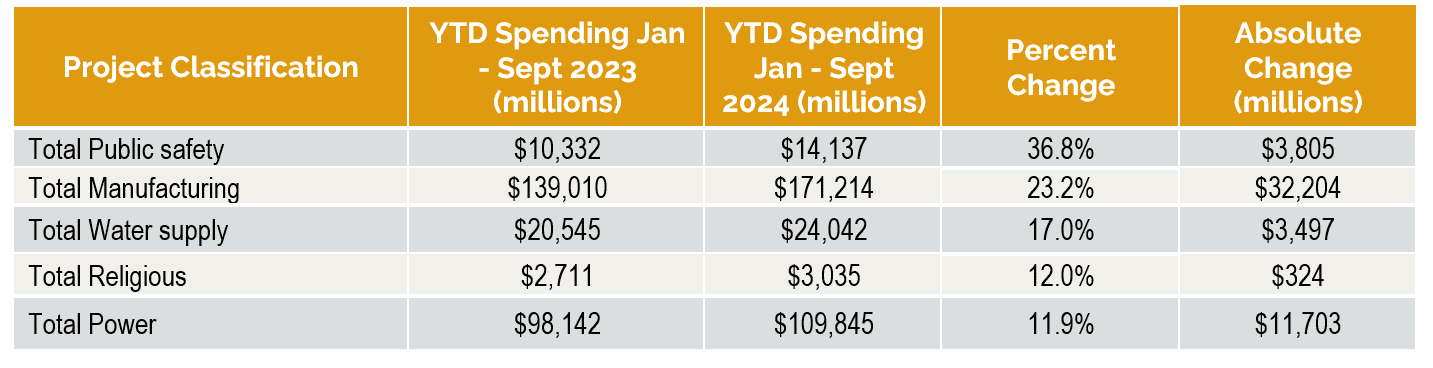
With respect to year over year growth in individual markets, manufacturing continues to be a top area for design & construction spending with total year to date (YTD) spending of $171.2b. The Water supply and Power markets are also maintaining robust growth.
For the sectors with the lowest levels of growth, two categories experiencing significant decline include lodging and commercial. These sectors and office are all sensitive to interest rate levels and reflect the impact borrowing costs have had on land development for these sectors. The office sector remains slightly positive due to Data Center growth being included in this classification.
EXPLORE THE DATA WITH OUR NEW INTERACTIVE DASHBOARD
Top Construction (Public & Private) Year to Date Project Growth by Classification
Bottom Construction (Public & Private) Year to Date Project Growth by Classification
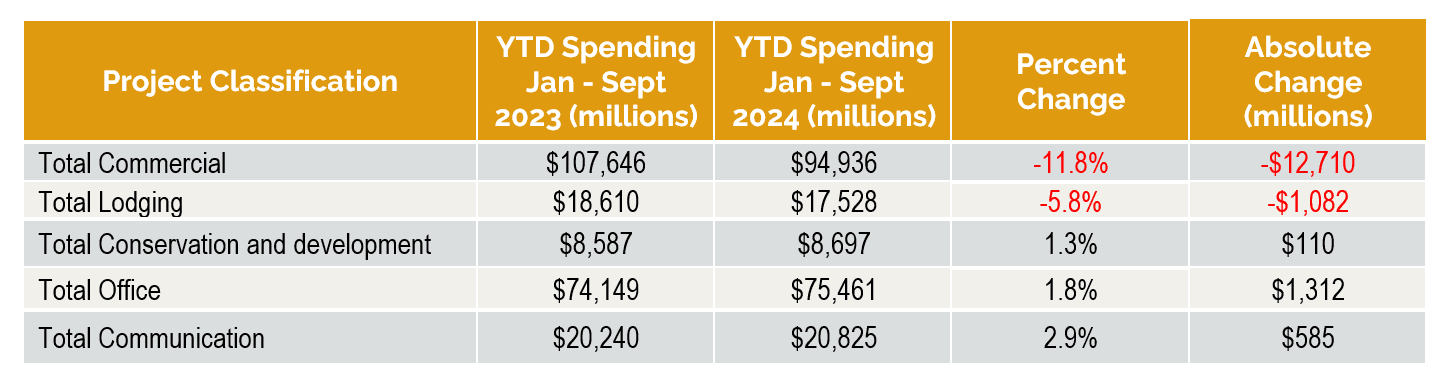
Source: US Census Value of Construction Put in Place Survey, November 1, 2024 release (Not Seasonally Adjusted).


Date
November 4, 2024
Category
ACEC NEWS, ACEC NEWS / ADVOCACY, ACEC NEWS / INDUSTRY NEWS, ACEC NEWS / INDUSTRY STATISTICS, ACEC NEWS / MARKET FORECAST