News

Recently, the US Census released the results of its monthly Value of Construction Put in Place Survey. The survey provides estimates of the total dollar value of construction work done in the U.S. This data includes design and construction spending for public and private projects.
EXPLORE THE DATA WITH OUR NEW INTERACTIVE DASHBOARD
The seasonally adjusted annual rate of $2.19 trillion for December 2024 represents a monthly change of 0.5%. This represents a 4.3% increase over December 2023.
Both Private and Public construction ended the year with total spending above 2023 levels, at 5.6% and 9.3% respectively.
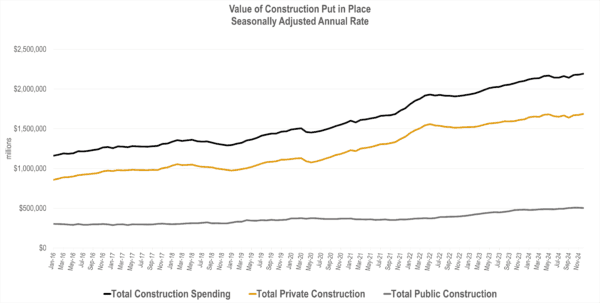
Source: US Census Value of Construction Put in Place Survey February 3, 2025 release
Preliminary nominal annual growth is 6.5%, consistent with last year’s 6.4%. This is in line with overall economic growth which grew at 2.3% for the 4th Quarter of 2024. The diversity of the construction industry is highlighted by the fact residential spending reversed last year’s decline of -5.9% with an increase of 5.9%. The positive effects of the residential market rebound are offset by declines in Commercial, Lodging, and Conservation & Development and weakening in other sectors at the end of the year.
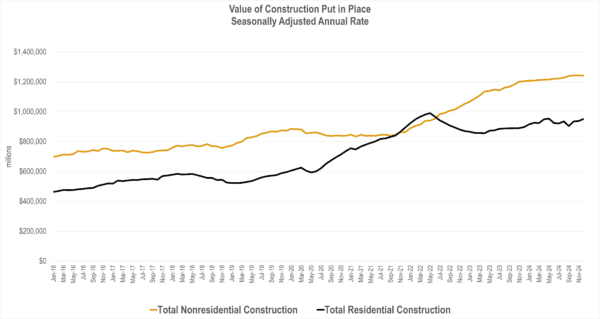
Source: US Census Value of Construction Put in Place Survey February 3, 2024 release
With respect to year-over-year growth in individual markets, manufacturing continues to be a top area for design & construction spending with total annual spending of $233.2b. The Water Supply, Amusement, and Power markets are also maintaining robust growth in double digits.
For the sectors with the lowest levels of growth, three categories experiencing significant decline include Lodging, Commercial, and Conservation & Development. These sectors and office are all sensitive to interest rate levels and reflect the impact borrowing costs have had on land development for these sectors. The office sector remains slightly positive due to Data Center growth being included in this classification.


Date
February 6, 2025
Category
ACEC NEWS, ACEC NEWS / MARKET FORECAST, BUSINESS MANAGEMENT / INDUSTRY STATISTICS, Market Intelligence