News

Recently, the US Census released the results of its monthly Value of Construction Put in Place Survey. The survey provides estimates of the total dollar value of construction work done in the U.S. This data includes design and construction spending for public and private projects.
The seasonally adjusted annual rate of $2.15 trillion for April 2025 represents a monthly decline of -0.4%. This is the third consecutive month of decline for the growth rate; the last time there were 3 consecutive months of decline was Summer 2022. Compared to April 2024, the total represents a -0.5% decline year over year. While Private construction saw a month over month decline of -0.7%, Public construction grew 0.4%.
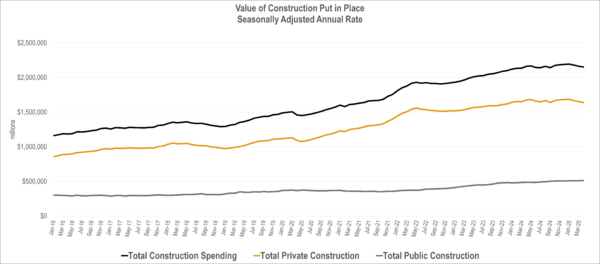
Source: US Census Value of Construction Put in Place Survey June 1, 2025 release
This decrease in growth is consistent with other economic data released recently. Revised estimates for 2025 Q1 GDP show contraction with a -0.2% real growth rate in GDP.
The overall decline in topline growth masks the underlying variance of sector specific growth. Factors such as higher for longer interest rates, changes in fiscal policy, trade uncertainty and other economic conditions account for this variability. The residential market declined -0.9% month over month while the nonresidential market declined -0.1%.
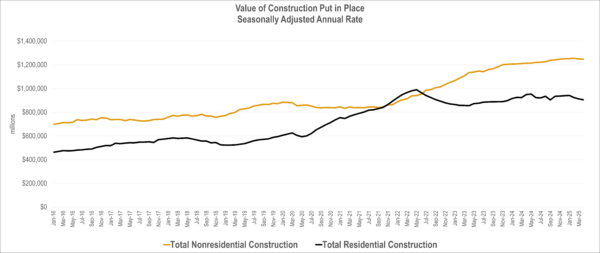
Source: US Census Value of Construction Put in Place Survey June 1, 2025 release
With respect to year to date growth in individual markets, 2025 continues a shift away from sectors that previously lead growth and new sectors emerging. The Water sector continues to grow in both Supply and Sewage & Waste Disposal, while growth in Amusement & Recreatoin & Transportation remains strong.
For the sectors in decline, Commercial continues to see declines due to interest rate sensitivity and other secular trends affecting demand. The Residential sector is seeing declines after rebounding from Spring 2023 lows, while Highway & Street continues to be negative. Health Care has just slightly climbed out of negative growth for the year.
EXPLORE THE DATA WITH OUR NEW INTERACTIVE DASHBOARD
Top Construction (Public & Private) Year to Date Project Growth by Classification
| Project Classification | YTD Spending Jan – Apr 2024 (millions) | YTD Spending Jan – Apr 2025 (millions) | Percent Change | Absolute Change (millions) |
| Total Religious | $1,358 | $1,571 | 15.7% | $213 |
| Total Amusement and recreation | $11,580 | $12,987 | 12.2% | $1,407 |
| Total Sewage and waste disposal | $12,844 | $14,300 | 11.3% | $1,456 |
| Total Water supply | $9,148 | $10,067 | 10.0% | $919 |
| Total Transportation | $19,768 | $21,157 | 7.0% | $1,389 |
Bottom Construction (Public & Private) Year to Date Project Growth by Classification
| Project Classification | YTD Spending Jan – Apr 2024 (millions) | YTD Spending Jan – Apr 2025 (millions) | Percent Change | Absolute Change (millions) |
| Total Commercial | $40,672 | $38,666 | -4.9% | -$2,006 |
| Total Residential | $282,827 | $279,996 | -1.0% | -$2,831 |
| Total Highway and street | $34,732 | $34,390 | -1.0% | -$342 |
| Total Lodging | $7,602 | $7,581 | -0.3% | -$21 |
| Total Health care | $22,303 | $22,364 | 0.3% | $61 |
Source: US Census Value of Construction Put in Place Survey June 1, 2025 release (Not Seasonally Adjusted).


Date
June 5, 2025
Category
ACEC NEWS / EDUCATION / MARKET FORECAST, ACEC NEWS / INDUSTRY STATISTICS, ACEC NEWS / MARKET FORECAST