News

Recently, the US Census released the results of its monthly Value of Construction Put in Place Survey. The survey provides estimates of the total dollar value of construction work done in the U.S. This data includes design and construction spending for public and private projects.
With an estimate of $1.996 trillion (seasonally adjusted) for the month of September 2023, this is the 9th consecutive month where construction spending rose, beginning the trend in December 2022.
Total Construction spending growth continues to be strong. Nominal values are still at all-time highs with 8.7% growth (seasonally adjusted).
- Month-over-month growth is 0.4%, a slight decrease from last month’s 0.5%.
- Spending growth continues to vary by project classification, with Private Residential spending seeing largest year-over-year (YOY) declines (-2.1%) and Private Manufacturing growth at 61.9% YOY.
- Year-to-date spending growth on Public Construction projects is significantly higher at 13.5% compared to Private Construction at 2.4%
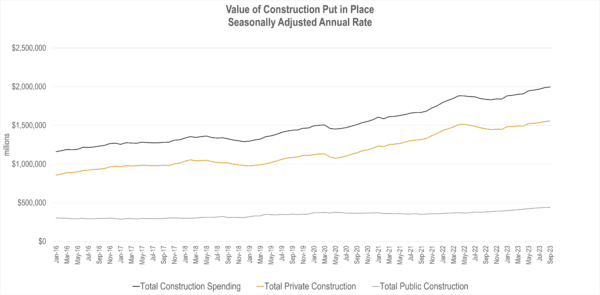
Source: US Census Value of Construction Put in Place Survey November 1, 2023 release
Nonresidential spending continues to have larger share of total construction spending since crossover in September 2022 though is plateauing
- Nonresidential project classifications grew at 19.0% YOY, an increase from last month’s 17.6%
- Total nonresidential saw a slight downtick in MoM growth at 0.3% compared to last month’s 0.4%
Residential spending continues upward growth from April 2023 low.
- -3.0% YOY growth in the latest survey is a significant improvement from last month’s reading of -9.6%.
- This marks the fourth consecutive reading of positive month-over-month growth, coming in this time at 0.6%.
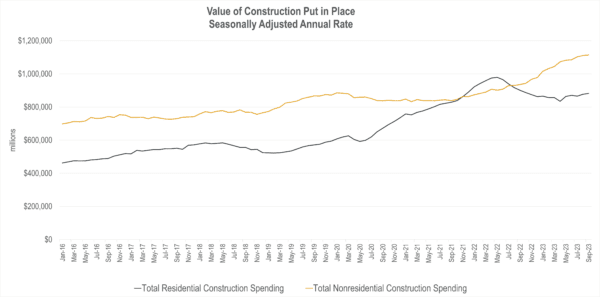
Source: US Census Value of Construction Put in Place Survey, November 1, 2023 release
We can point to fiscal policy and subsequent private investment in sectors like manufacturing, transportation and wastewater as supporting these high growth levels, while the residential sector rebounds slightly. Compared to last month, the Total Power sector continues to grow and is no longer a “bottom” growth category, spurred by increased government spending in this category.
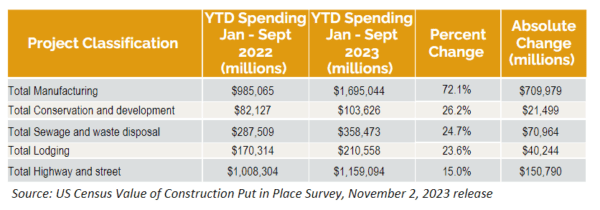
Top Construction (Public & Private) Year to Date Project Growth by Classification
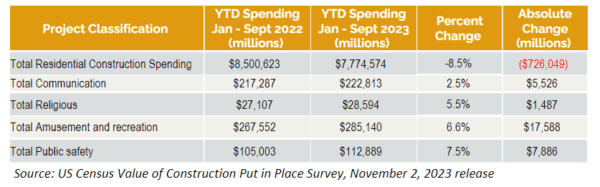
Bottom Construction (Public & Private) Year to Date Project Growth by Classification


Date
November 6, 2023
Category
ACEC NEWS / INDUSTRY NEWS, ACEC NEWS / INDUSTRY STATISTICS, ACEC NEWS / MARKET FORECAST, INDUSTRY NEWS, INDUSTRY NEWS / INDUSTRY STATISTICS, INDUSTRY NEWS / MARKET FORECAST, Private Markets